

| Some Site Statistics Posted by grahame at 07:25, 3rd April 2012 |     |
I keep an eye on forum statistics ... and yesterday morning, I added Google Analytics into the Coffee Shop in order to get an idea of the geographic spread of visitors. Here are the top six locations from which this site was visited:
:
1. London 119 6.49
2. Bristol 37 10.46
3. Cardiff 21 8.29
4. Plymouth 20 6.80
5. Oxford 18 6.67
6. Bath 17 20.12
2. Bristol 37 10.46
3. Cardiff 21 8.29
4. Plymouth 20 6.80
5. Oxford 18 6.67
6. Bath 17 20.12
Reading the data ... an example row:
Plymouth was 4th most popular, 20 different visits averaging just under 7 pages viewed per visit.
Of a total of 481 different visits, 457 were from within the UK.
It's good to see hundreds of visitors in what was probably just a typical day, and people sticking around looking at multiple pages too. I suspect there's quite a few commercial sites who would like real visitors coming through at these rates, and it does confirm that what's posted here gets seen / read / answered.
| Re: Some Site Statistics Posted by devon_metro at 11:32, 3rd April 2012 | |
How accurate is Google analytics w.r.t location of users? I know my Bristol address thinks i'm in Ealing London which might skew the data!
| Re: Some Site Statistics Posted by grahame at 11:55, 3rd April 2012 | |
How accurate is Google analytics w.r.t location of users? I know my Bristol address thinks i'm in Ealing London which might skew the data!
It gives a pretty good general idea - 4 out of 5 are likely to be within 20 miles, and 19 out of 20 (or even better) correct by country; those are figures I've seen mentioned and look sensible with the data involved. I also track our own company high volume web site and see very different patterns indeed. All of which confirms a general statement that "the overwhelming majority of people who visit our site are doing so from the area served by trains operated by First Great Western".
Here, as an interesting comparison, is our own company website where we added analytics for some pages starting about 3 weeks ago, and have built up since - you'll see a very different pattern within the UK:
:
1. London 2,213
2. Melksham 645
3. Bristol 379
4. Cambridge 207
5. Birmingham 172
6. Manchester 172
2. Melksham 645
3. Bristol 379
4. Cambridge 207
5. Birmingham 172
6. Manchester 172
And overseas too, for example:
:
1. San Francisco 449
2. San Jose 268
3. Sunnyvale 260
4. San Diego 249
5. Los Angeles 201
2. San Jose 268
3. Sunnyvale 260
4. San Diego 249
5. Los Angeles 201
| Re: Some Site Statistics Posted by LiskeardRich at 22:34, 3rd April 2012 | |
The location stats will be skewed at the moment, as all bt broadband users in devon and cornwall currently report as bristol due to technical issues. This problem is unique to BT users only
| Re: Some Site Statistics Posted by Btline at 23:11, 3rd April 2012 | |
Any interesting locations in the UK for high usage? i.e. out of the FGW network
| Re: Some Site Statistics Posted by EBrown at 01:46, 4th April 2012 | |
Any interesting locations in the UK for high usage? i.e. out of the FGW network
Well I'm generally logging on from Kent, Canterbury. Although KentMAN, Janet's (Joint Academic NETwork) RNO (Regional Network Office) I believe is Ashford, Maidstone or Medway not Canterbury, so that may be the routing point. (Techno-babble for fast academic network - although we should be moved onto SuperJanet5 soon; which is 1Gbps not 100mbps as a user speed.)I also log on from a server in San Diego occasionally!

That provides a little data skew.
| Re: Some Site Statistics Posted by bobm at 06:16, 4th April 2012 | |
I think BT Broadband is notorious for skewing locations. Although my broadband is in Swindon it shows as Milton Keynes. Sky on the other hand is very accurate and if I am in Bracknell it says I am. It's very annoying because I have been trying to get some location data from my own websites and it is hard to be confident in the results. (Not that I have anything like the programming skills of grahame!)

| Re: Some Site Statistics Posted by Brucey at 20:03, 4th April 2012 | |
TalkTalk shows me as being from Brighton on Google Analytics, when we are just north of Portsmouth.
I have a lot of visitors from Milton Keynes, who are on Orange (landline, not mobile). I could never work out whether the location was skewed or because I have occassionally promoted my website to people who live near Milton Keynes.
| Re: Some Site Statistics Posted by devon_metro at 22:54, 4th April 2012 | |
Another interesting one perhaps, 3G connections? Do they provide the location of the mast providing the signal or whereever the Mobile operators servers are based?
I would try but I don't get 3G coverage in deepest darkest Zummerset
| Re: Some Site Statistics Posted by grahame at 10:42, 7th April 2012 | |
A slightly different database says 2/3 are within 25 miles:
http://www.maxmind.com/app/city_accuracy
We can't rely on accurate placement to a town or city for an individual hit, but the statistics give us a general picture and become clearer when compared to the same diagrams / stats for other sites (I'm now running Analytics on 4 different domains). During next week when I have a full 7 days of data, I'll come back with a report of that period and some elements of inconsistency will be smoothed out. Mind you, with Easter in the data period, I won't be claiming a "typical week" as I think Dr Beeching once did with the week before or after Easter, and look at the legacy he left us!
| Re: Some Site Statistics Posted by grahame at 03:05, 16th April 2012 | |
During next week when I have a full 7 days of data, I'll come back with a report of that period and some elements of inconsistency will be smoothed out. Mind you, with Easter in the data period, I won't be claiming a "typical week" ...
9th (Easter Monday) to 15th April inclusive:
1. London 1,408 5.51
2. Bristol 372 13.65
3. Oxford 247 7.04
4. Reading 218 4.67
5. Birmingham 185 5.12
6. Bath 179 23.38
7. Plymouth 162 7.83
8. Cardiff 129 6.36
9. Southampton 112 8.66
10. Worcester 92 7.10
| Re: Some Site Statistics Posted by TonyK at 18:05, 16th April 2012 | |
TalkTalk shows me as being from Brighton on Google Analytics, when we are just north of Portsmouth.
If I use IE8, I am in Cardiff. If I use Opera, I am in Poland. If I look out of the window, I and in Bristol.
Dziekuje! (Or should I say Diolch yn fawr?)
| Re: Some Site Statistics Posted by devon_metro at 14:19, 17th April 2012 | |
I'm apparently in Crawley now, my home address in Bristol has recently been showing Doncaster!!
| Re: Some Site Statistics Posted by thetrout at 02:10, 19th April 2012 | |
Some members are right in saying that Data can be skewed.
It all depends on which DSLAM (The system that your Home/Work Router terminates to when using ADSL/VDSL etc) and also who your provider is. For example, If you're in the South West and on PlusNet for example. Your connection almost all the time will show up as in London (Most likely the Global Switch Data Centre - where a few ISP's have their terminating kit).
Virgin Media is reasonably accurate, as they have street cabinets, that all route to a major node. So if you're for example the Frome, Westbury or Warminster areas, you'll terminate to the Trowbridge Node. So you'll normally show up in Trowbridge or as near as.
BT is a nightmare of an Internet Network. As they are known as the "Principle Operator" of the PTSN (Public Telephone Switching Network) Exchanges, they can terminate your connection anywhere that there is capacity at the time. So you may be in Exeter for example, but your connection may show up somewhere really obscure and miles away from where you actually are.
Also the majority of ISP's give out Dynamic IP Addresses. So if you unplug your router and plug it in again, the chances are you'll get a completely new IP Address, which could show up as somewhere completely different.
o2 Broadband has a habit for skewing geographic data too. My backup connection at my office in Frome normally shows up in Bracknell or Slough - of which I am nowhere near either.
Interestingly enough though. It depends on the operator and if they have an LLU agreement with BT in the area. What this is, is where the ISP have installed their own equipment and backbone connections into a BT Exchange for their customers. TalkTalk do this for example. If you're in a TalkTalk LLU area and you want to switch just your broadband to another ISP. It doesn't work, as TalkTalk use their own backbone lines and servers for the telephone lines and in actuality, all they pay BT Openreach (Company who own the telephone network; a completely different company from BT Retail and BT Business Retail) for is the rental for the copper wire from the BT Exchange to the customer premises (There's an acronym for that too, think it's CPE but it's 1:58AM and my mind is fried from staring at Exchange Server Logs Files all day
 ) They also pay a service fee for the line in case a problem develops on the line between the CPE and Exchange and they are required to actually fix it.
3G is a different kettle of fish altogether. My understanding (Although this may have changed since) was that you don't have a "Public IP" on a 3G network. What actually happens is the provider is running a massive NAT network. There is always 1 PoP (Point of Presence) depending on the location. I did a test on this on Hutchinson 3G. Travel from Taunton to London and the last time i did this my terminating location was Slough - which didn't change. This would make sense as there is a huge amount of Data Centre's and Internet Pipes in that area. Rackspace (Mods please note that this isn't an advertisement as I am not connected with them in any way) have one of their 9 Cloud Data Centres in Slough. You may have seen recently the "Bang Goes The Theory" regarding IT and Mobile Security, where they did an interview with a Cloud Hosting Provider. Although the program said they couldn't declare the providers name... Anyone in the Internet Connectivity area of IT knows it was Rackspace!
Incidentally, last year Thames Water dug up the Fibre Cables in Slough. This caused everyone on traditional BT 20cn and 21cn connections i.e. connections that use the BT Network to effectively piggyback to the ISP network (As is the case with an Internet Connection on any rural exchange or exchange with no LLU providers) to completely crash. It took out the entire southwest. However, users on LLU services such as o2 and TalkTalk were mostly unaffected as they use their own equipment.
Sorry, I really went on there didn't I! But I run a business which focuses on Internet Collaboration hence why I pick up this useless information... Which one day may actually prove useful to somebody!


*edit* removed a typo which was a typo, but said typo manifested itself as a rather rude word which has happened twice this morning!
| Re: Some Site Statistics Posted by grahame at 07:17, 19th April 2012 | |
A fascinating and detailed insite there into the various issues involved - and to add that looking at raw log files on a server, it's sometimes possible to work out the connection type, and sometimes not. All of which means we can't trust individual entries, and the who setup gets biased towards certain places. Where it is useful is in comparison between sites, or between two parts of the same site - looking not at the actual numbers but at the relative proportions. Often, that will confirm what you hope (such as "most of our users seem to be in GW land, compared to a nationwide site") but occasionally it will point out an apparent oddity which can be worth investigating.
| Re: Some Site Statistics Posted by LiskeardRich at 10:19, 19th April 2012 | |
With regards to BT, I have noticed many friends facebook posts stating "posted near Veryan" Which is a tiny little village on the Roseland Peninsular. This appears to be people posting in the west of Cornwall, so must be where the exchange that BT are using for most of west cornwall recently
| Re: Some Site Statistics Posted by thetrout at 22:34, 19th April 2012 | |
My geography of Cornwall is fading. But that sounds like their connections are terminating at Goon Hilly Satellite Earth Station. Where the big comms dishes are and also the end of some deep sea Fibre Cables ;-)
| Re: Some Site Statistics Posted by Chris from Nailsea at 01:15, 20th April 2012 | |
My geography of Cornwall is fading. But that sounds like their connections are terminating at Goon Hilly Satellite Earth Station. Where the big comms dishes are and also the end of some deep sea Fibre Cables ;-)
You're losing your touch, thetrout: you are indeed quite right!
See http://en.wikipedia.org/wiki/Goonhilly_Satellite_Earth_Station
| Re: Some Site Statistics Posted by thetrout at 02:09, 20th April 2012 | |
I haven't lived in Cornwall for over 5 years and it's 2AM so surely an honorable brownie is in order.
The name Roseland Peninsular puzzled me... I always knew it as The Lizard Peninsular
But for a useless fact of the day, when you make an Overseas Phone Call, the chances are it's routed via Goon Hilly
If you're ever in the area, it's well worth a visit! A fantastic day out and some of the things and history you'll pick up IMO is fascinating
As an aside I didn't think I'd spend the first 30 minutes of my 22nd year in Coach F on a HST to Taunton but each to their own...
| Re: Some Site Statistics Posted by ellendune at 19:50, 20th April 2012 | |
I haven't lived in Cornwall for over 5 years and it's 2AM so surely an honorable brownie is in order.
The name Roseland Peninsular puzzled me... I always knew it as The Lizard Peninsular
But for a useless fact of the day, when you make an Overseas Phone Call, the chances are it's routed via Goon Hilly
The name Roseland Peninsular puzzled me... I always knew it as The Lizard Peninsular
But for a useless fact of the day, when you make an Overseas Phone Call, the chances are it's routed via Goon Hilly
Of course before Goon Hilly it was Porthcurno where all the deep sea cables were terminated.
However, the Veryan I know is not on the Lizard Peninsula which is where Goon Hilly is, but is indeed on the Roseland Peninsula, which is to the east of the Fal estuary.
| Re: Some Site Statistics Posted by Brucey at 19:53, 20th April 2012 | |
In the last few hours, I've moved from Brighton to Hove. This move appears to have occurred retrospectively.
My university also appears to have relocated from it's false location of Kempston to the actual location of Cranfield.
| Re: Some Site Statistics Posted by LiskeardRich at 23:14, 20th April 2012 | |
I haven't lived in Cornwall for over 5 years and it's 2AM so surely an honorable brownie is in order.
The name Roseland Peninsular puzzled me... I always knew it as The Lizard Peninsular
But for a useless fact of the day, when you make an Overseas Phone Call, the chances are it's routed via Goon Hilly
If you're ever in the area, it's well worth a visit! A fantastic day out and some of the things and history you'll pick up IMO is fascinating
As an aside I didn't think I'd spend the first 30 minutes of my 22nd year in Coach F on a HST to Taunton but each to their own... 
The name Roseland Peninsular puzzled me... I always knew it as The Lizard Peninsular
But for a useless fact of the day, when you make an Overseas Phone Call, the chances are it's routed via Goon Hilly
If you're ever in the area, it's well worth a visit! A fantastic day out and some of the things and history you'll pick up IMO is fascinating
As an aside I didn't think I'd spend the first 30 minutes of my 22nd year in Coach F on a HST to Taunton but each to their own...
The reason its puzzling you is that the lizard peninsular and roseland peninsulars are two seperate places, roseland is about 25 miles east of the lizard, where st mawes is heading towards st austell from truro. Therefore completely unrelated to goonhilly
| Re: Some Site Statistics Posted by Chris from Nailsea at 02:26, 21st April 2012 | |
There you are, then: "Pay attention, young trout!"
| Re: Some Site Statistics Posted by grahame at 14:19, 28th April 2012 | |
9th (Easter Monday) to 15th April inclusive:
1. London 1,408 5.51
2. Bristol 372 13.65
3. Oxford 247 7.04
4. Reading 218 4.67
5. Birmingham 185 5.12
6. Bath 179 23.38
7. Plymouth 162 7.83
8. Cardiff 129 6.36
9. Southampton 112 8.66
10. Worcester 92 7.10
Now that we're well out of the Easter period - data from 21st to 27th April inclusive:
1. London 1,473 4.59
2. Bristol 423 14.65
3. Oxford 234 6.51
4. Plymouth 185 6.35
5. Reading 185 4.85
6. Bath 171 7.78
7. Birmingham 169 4.61
8. Milton Keynes 129 7.19
9. Cardiff 119 5.87
10. Southampton 109 8.20
| Re: Some Site Statistics Posted by LiskeardRich at 21:18, 7th July 2012 | |
I suspect I will be easily identifiable in the next range of stats. Im visiting the site today from le tranche-sur-mer in the vendee region of France.would be interested where exactly it defines me as visiting from though!
| Re: Some Site Statistics Posted by grahame at 21:38, 7th July 2012 | |
I suspect I will be easily identifiable in the next range of stats. Im visiting the site today from le tranche-sur-mer in the vendee region of France.would be interested where exactly it defines me as visiting from though!
I'll have a look and see what the overnight stats say about French visits then.
| Re: Some Site Statistics Posted by grahame at 08:39, 8th July 2012 | |
I suspect I will be easily identifiable in the next range of stats. Im visiting the site today from le tranche-sur-mer in the vendee region of France.would be interested where exactly it defines me as visiting from though!
"Featuring France" ...
In the week to midnight last night, we had 33 visits from France. On average, each visited 2.55 pages. 36% of the visits were to just a single page. Here's how they were distributed:
By comparison, we had 5583 visits from the UK, on average looking at 4.67 pages, out of a total of 6019 visits to the site. 131 visits can't be identified to their country of origin. There were a total of 52 visiting countries, with single visits form some distant countries such as Kyrgyzstan, Uganda, South Korea and Saudi Arabia.
In the UK, there were more visits from each of Cheltenham (39), Yeovil (43), Staines (51) Guildford (55), Melksham (59) and Teddington (67) than there were from the whole of France. Top 4 UK visiting cities were London, Bristol, Oxford and Bath, accounting between just those 4 for 2143 of the 5583 UK visits. Amongst towns from which we had just a single visit were Addlestone, Basildon, Chatteris, Dartford, Eastleigh, Fleetwood, Gravesend, Hailsham, Ilkley, Kettering, Lancing, Macclesfield, Nantwich, Ormskirk, Pudsey, Ripon, Saxmundham, Tadcaster, Uttoxeter and Wallington.
| Re: Some Site Statistics Posted by Andrew1939 from West Oxon at 16:32, 8th July 2012 | |
It just goes to show what a well read site the coffee shop is.
| Re: Some Site Statistics Posted by Btline at 16:36, 8th July 2012 | |
Quite - very impressive!

| Re: Some Site Statistics Posted by bobm at 16:57, 8th July 2012 | |
When I started to read this thread I was at Bridgwater. Now I'm approaching Weston-super-Mare!
| Re: Some Site Statistics Posted by grahame at 06:43, 1st August 2012 | |
For my end of July update, I'm going to focus on the ups and downs of the last couple of months, and looking for any significance therein.
In June, there were just over 1000 posts to the forum, with 78 new topics opened, and that was the quietest month for a very long time indeed. Yet in July, without any "marketing push" or anything at our end, posts rocketed to over 1700 making it the third busiest month of the year, and 126 new topics were started. These figures from http://www.firstgreatwestern.info/coffeeshop/index.php?action=stats
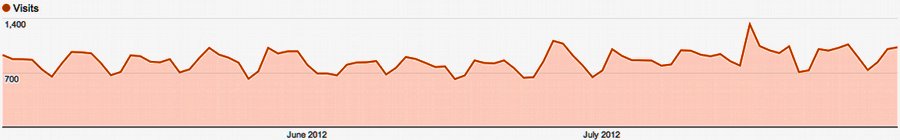
Before you jump to any conclusions - consider some other stats. From our Google Analytic stats we had 23,850 visits in June, rising to 28,600 visits in July. Pageviews were 112,645 in June, rising to 161,127 in July, with pages per visit moving up from 4.72 to 5.63
71% increase in posts.
61% increase in subjects.
43% increase in pageviews
40% increase in pages viewed per visit
20% increase in visits.
and let's not forget
3% increase in reporting period (30 days -> 31 days)
Google analytics also reports 21,861 unique visitors across the whole 2 month period, with over 49,000 of 52,000 visits from the UK (and the second most popular "country" was unknown / unidentificable - a further 900 visits).
I'm going to suggest that June was something of a lull month in railway news - "quietly as she goes", whereas there's been quite a lot happening in July. Still lots of visits in June - just not so much to comment on. More visits in July, and more to read and comment on too, hence the rises in visitor numbers, pages viewed per visit, and new posts.
And when all's said and done, 31,477 unique visitors in the last 3 months is an awful lot of people looking at the site, and they're averaging over 5 pages per visit.
May, June, July - visits per day to tracked pages on this site:
| Re: Some Site Statistics Posted by JayMac at 21:20, 1st August 2012 | |
I think we can thank the DfT for the very busy July. They gave us HLOS for Control Period 5, the Intercity Express Programme contract award and the Invitation to Tender for the Greater Western Franchise.
| Re: Some Site Statistics Posted by johoare at 14:55, 4th August 2012 | |
..and there were quite a few major delays/issues in July too which will explain a bit of the increase I imagine...
| Re: Some Site Statistics Posted by grahame at 09:25, 1st October 2012 | |
In September, we had 26,631 visits from 11,756 unique visitors. Pages viewed were 147,806 and the average duration was 6 minutes and 27 seconds. 24,991 visits were identified as being from the UK. And that's according to Google Analytics. Top cities reported were London, Bristol, Oxford, Birmingham, Reading, Bath and Cardiff. Amongst 300 places that reported just a single visit were Maraciabo, Dershingham, Allentown and Aberdeen (turns out to be one of the Aberdeens in the USA; there were 14 from the Aberdeen in Scotland).
Our local stats show 1430 posts, with 121 new topics started - that's about 48 posts and 4 new topics per day - not bad going, when you consider that so much has already been asked and said over the years. Over 5000 applications were made to join the forum - the vast majority being "forum spammers" who have already been reported by other forums, and whom we (the admins) are able to reject quite quickly; Chris_f_n - I really appreciate your assistance in going through these, as we really don't want to accidenatlly reject, or delay, genuine signups.
Personally, September saw me travelling far and wide within the UK. For three of those trips, I was able to use the train ... for others (such a Weymouth and Worcester), the lack of trains pushed me onto the road - and that was a lack of trains at appropriate times, and not a lack of railway lines. The Worcester trip would have been "saved" to the train if it weren't for the withdrawl of the mid evening bus back to my home town at the start of the month.
| Re: Some Site Statistics Posted by grahame at 09:14, 1st November 2012 | |
Sharing some of the October stats with you:
Visitors per hour:
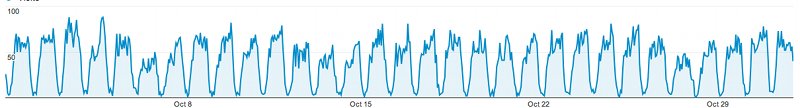
Overall statistics from real browsing visitors (robots and crawlers don't log with Google)

Splits by country (top ranked only shown):

Split within the UK by town / city (top ranked only shown):
| Re: Some Site Statistics Posted by thetrout at 11:26, 1st November 2012 | |
Interesting stats
I think some of them may be slightly out of area though. A lot of ISP's (PlusNet and Eclipse/KCOM) Spring to mind use BT Wholesale Trunk Lines to the ISP networks which are mostly based in London. So even though you appear to be in London, you are in actuality much, much further away


| Re: Some Site Statistics Posted by grahame at 23:30, 1st December 2012 | |
29033 "real"visits from the UK out of 30,896 to the forum in November. At the other end of the scale, single real visits from Albania, Azerbaijan, Bosnia and Herzegovina, Brazil, Belarus, Chile, China, Guernsey, Croatia, Isle of Man, Iceland, Jordan, Cambodia, Kuwait, Lebanon, Luxembourg, Maldives, Puerto Rico, Serbia, and Uganda
Busiest day - 22nd November with 1,335 visits; quietest 24th with 838. The busiest hour with 105 visits was from 21:00 on 21st November. I think we see the effect of the weather on the forum, just as we've seen the effect of the weather on our area's rail services.
| Re: Some Site Statistics Posted by bobm at 20:33, 2nd December 2012 | |
What amazes me is the number of sign-ups each month and how it has grown over time. Much as it would be great if they were all "genuine" sign-ups many must be, as has been reported before, joining for reasons far removed from the topics we like to discuss on here. The fact that so few ever see the light of day is a tribute to the rear-guard action fought by the powers that be to keep them at bay.
In search of meaningful statistics what sort of percentage of sign-ups are classified as bona fide?
| Re: Some Site Statistics Posted by grahame at 07:29, 3rd December 2012 | |
In search of meaningful statistics what sort of percentage of sign-ups are classified as bona fide?
As I write, there have been 91,497 applications for membership since the forum started and we curently have 1,238 approved members. Only a handful of approved members have ever been deleted, so that's an overall ratio of 73:1.
Now - that's not really 'meaningful' as it combines two phases. Let me try for something current ... 24 new members approved during November, stats say 9342 applications, so you're looking at around 1 in 400 accepted.
The administrators have mechanisms in place to help us identify the genuine signups, and it's not a case of us having to manually reject all that lot. Where there's a doubtful case, we can always instigate an email conversation with the potential member to clarify their credentials; it may look a bit nosey, but it helps us maintain the security and effectiveness of the board. And can I please reassure anyone who's thinking of joining that people with a genuine interest are very welcome indeed - we try to make it as easy for you as possible.
| Re: Some Site Statistics Posted by grahame at 09:28, 1st January 2013 | |
We concluded 2012 with the busiest month of 2012 - no fewer that 1982 new posts, in what's usually quite a quiet month as people head off for a Christmas break. But this year was different - perhaps because of how difficult train travel was for many people looking to get away - see http://www.firstgreatwestern.info/coffeeshop/index.php?topic=11794.msg123310#msg123310
In the final quarter of 2012, we had 88,504 visits to the coffee shop of which 83,502 were identified as being from within the UK. Many people visit us multiple times - Google Analytics tells us that we've had 37,858 unique visitors in that period, which is an impressive number - it helps put some sort of measure onto "guests" who are an an important part of our customer base - reading and learning from the material here, but leaving such a light footprint that they're not often noticed.
| Re: Some Site Statistics Posted by grahame at 00:40, 1st February 2013 | |
Another traffic rise in January - 2361 new posts, which is the highest for years (since July 2010). I'm trying to work out why; December 2012 was the highest for 2012, with that number encouraged by the truley horrible performance (much of it weather related) up to Christmas, and if you had asked me for a January forecast I would have got it wrong.
You'll see from the stats that our signup requests (1721) are down to around a fifth of what they were in November (9384) ... that's an artificial change; the majority of signups are what's known as "forum spam" and stronger filters have allowed the exclusion of much more of this traffic without any significant hit in genuine requests.
Some stats from Google Analytics .... 33,026 (14,588 different) visitors in the month calling up a total of 192,624 pages. December stats 29,355 / 12,714 / 173,785. 31,080 visitors were from the UK, and a further 446 might have been, but could not be identified to anywhere for certain. Average visit duration was 6 minutes and 25 seconds, with visits away from the UK having a much lower duration. Towns and cities listed are predominantly in the GW area; not a reliable measure, except that when I compare it to our other sites, the pattern's quite different.
| Re: Some Site Statistics Posted by grahame at 06:10, 1st May 2013 | |
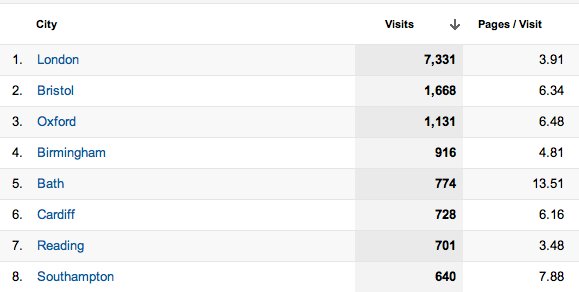
Some of our members keep returning, and others just call in occasionally. Likewise we have guests who drop ir regularly (even frequently), and guests who come here just once. What's the split, and how long do people stay? In April, we had 31,849 visits (30,318 from the UK) accounted for by 12,616 unique visitors. These are Google Analytics figures, so real figures - although the unique visitor count will count you twice if you use two different computers. The visitors viewed no less that 175,786 pages in total - that's between 5 and 6 pages on average. I've provided a graph of this through the month.
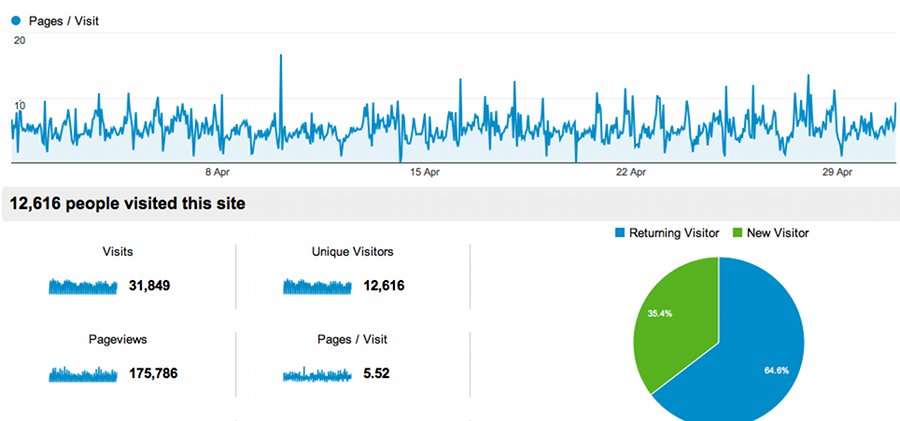
As you might expect, visitors are typically here from 7 a.m. to 11 p.m. with the highest spikes between 7 p.m. and 8 p.m. - up to 90 visits per hour. (not seen in the graph above) with a handful of visitors even during the wee small hours.
Posts in April were over 2000 for the fourth successive month - that's starting to look like a significant change from 2012 (when the figure was between 1010 and 1982 per month) and 2011 (when only 2 months exceeded 2000). It's hard to guess why it's increased - are we getting more popular, are peope finding us more welcoming and feeling freer to post, or is the railway industry and those parts we're involved with giving us more to talk about?
| Re: Some Site Statistics Posted by grahame at 08:29, 2nd June 2013 | |
Many thanks to Chris from Nailsea for his monthly update on site use at http://www.firstgreatwestern.info/coffeeshop/index.php?topic=10596.0 . That gives a useful month on month, year on year picture of our growth / shrinkage / stability, whether it's due to our own performance in running the forum or the desire of people to chat about the rail and related issues we cover.
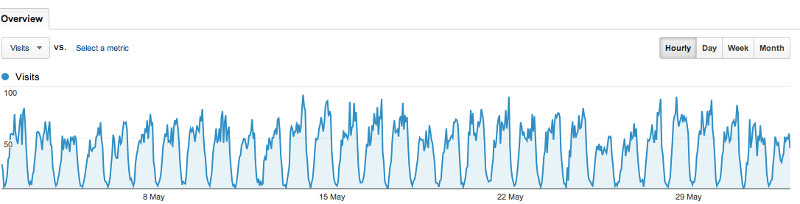
Continuing here with my semi-regular series in which I pick out an aspect of our performance from the last month, I've taken a look at weekly cycles - which day of the week is busier. Graph shows number of visits per day:
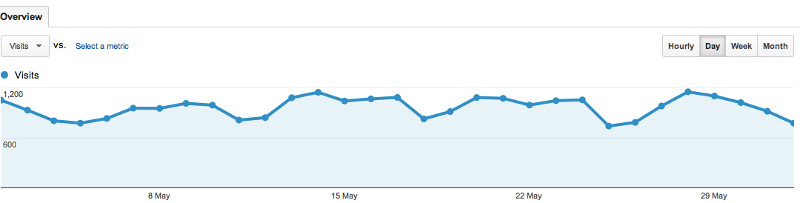
Interesting to note that Saturdays are consistently quieter. Looking at the same graph hourly, I find it harder to see that same trends - but it *is* there with lower daytime peaks:
| Re: Some Site Statistics Posted by grahame at 08:05, 1st November 2013 | |
Here we are in November, with similar numbers to those we had earlier in the year ... 31370 visits (of which 30097 were from the UK) from 13895 unique visitors, 152114 page views in the last month. Top cities - London, Bristol, Oxford, Maidenhead, Cardiff, Birmingham, Plymouth, Reading, Bath and Exeter. We know this latter data tends only to give a geographic trend; its interesting to compare it to another site we host that includes Cambridge, Southampton and Milton Keynes, Brighton, Edinburgh, Leeds and Northampton in the 'top city' list. No big surprises; graph shapes still the same, though with a surge last weekend (30% higher traffic) in the run up to and aftermath of the big storm.
| Re: Some Site Statistics Posted by grahame at 11:25, 1st January 2014 | |
To augment Chris's regular monthly update, I'm following up here on my "occasional" series of site statistics, and I've taken the new year as an opportunity to go right back and analyse annual posts and new topics to the very start of the forum.
In year 2007 there were 7330 new posts in 1320 new topics
In year 2008 there were 25211 new posts in 2747 new topics
In year 2009 there were 25925 new posts in 1892 new topics
In year 2010 there were 24293 new posts in 2111 new topics
In year 2011 there were 21836 new posts in 1807 new topics
In year 2012 there were 18682 new posts in 1657 new topics
In year 2013 there were 22285 new posts in 1533 new topics
We should ignore 2007 ... as the forum didn't exist until the end of January, and then needed "seeding" and nurturing. But since then we've been remarkably stable. During this time there have been major changes at First Great Western - in many / most cases for the better, yet at the same time the extra loading of more and more passengers has created new problems, and at times it's seemed that factors such as the weather have got more extreme, leading to to tougher operational issues. And of course the stock has got older - I don't think that First Great Western are operating a single piece of rolling stock manufactured since the forum started.
As time goes on, is there less to talk about? It would appear not. The number of new topics drops, but that's because so much carries on with existing discussions. 1488 of the posts in 2013 were on the "Reading Station Improvements" thread which was started in 2010 and it's great to see the continuity and interaction of discussions there - we really shouldn't worry about a modest decrease in new topics.
As ever ... a big thank you to my fellow admins, to the moderator team, and especially to all the forum's contributing members for making the coffee shop a successful, and a pleasant, place to spend a few hours!
Long forgotten about now by most members, I expect, was the unplanned server switch in June which took the forum down for a few hours, with progressive recovery over the following day. And as the forum came back on line, security algorithms changed meaning that every active member had to reset their password / account to log in. Although we were very concerned at this at the time, it's wonderful to see that the effect on the ongoing success of the forum appears to be minimal.
| Re: Some Site Statistics Posted by grahame at 12:45, 1st January 2014 | |
For anyone who's interested in seeing the program I used, I've put in online at http://www.wellho.net/resources/ex.php?item=y106/forum.py and added further commentary at http://www.wellho.net/mouth/4236_Using-Python-to-analyse-last-years-forum-logs-Good-coding-practise-discussion-.html .
<advert>Please tell your techincal friends and colleagues (and yourself) that if they or you want to learn Python (or Ruby, Perl, PHP, Lua, C, C++ or Tcl) that I'm your man. You'll be helping to keep the server that hosts this forum running (it has to be paid for somehow!). And - new for 2014 - you can travel practiaclly travel all the way to us by much more sustainable public transport. If I'm coming to train you on site, I'll be coming all the way by train 9 times out of 10! See http://www.wellho.net </advert>
| Re: Some Site Statistics Posted by TonyK at 19:33, 1st January 2014 | |
<advert>Please tell your technical friends and colleagues (and yourself) that if they or you want to learn Python that I'm your man.
I do a reasonable "Dead Parrot" sketch myself, you know...
| Re: Some Site Statistics Posted by grahame at 06:58, 1st November 2014 | |
It's quite a while since I updated this occasional series of "how is the forum doing?" reports ... so a good time to look at the last three months, and compare them to a couple of months at the beginning of the year - what I would describe as a typical January, and an extraordinary February (when the sea wall breach at Dawlish coincided with a huge surge of visitors).
:
Month Aug Sept Oct Jan Feb (2014)
Sessions 31906 28198 31734 31419 37701
Users 13598 11187 12018 12685 16801
Pageviews 158281 147343 190408 155562 204850
Pages/session 4.96 5.23 6.00 4.95 5.43
Bounce Rate 43.10% 40.10% 36.92% 41.92% 41.55%
New Sessions 38.30% 35.32% 33.71% 35.95% 40.49%
Busiest Hour 91 s. 79 s. 107 sessions 94 s. 180 s.
UK visitors 94.44% 95.01% 95.22% 95.43% 92.80%
New Posts 1887 1782 2291 1645 2424
New Topics 153 171 182 135 104
The top eight statistics are from our Google Analytics, the bottom two are from our forum stats.
As a quick "how are we doing" shorthand, I keep an eye on the "New Posts" on the forum - and indeed Chris from Nailsea's graph, updated every month at the top of this board, keeps us all usefully in the picture on that - thanks for keeping that up, Chris.
In my view, the figures combine to show a picture of good stability, with the biggest changes being due to the external feature of whether or not there are big happenings effecting passenger train services in the Great Western area - those changes aren't a surprise and are welcomed as they show that we're in line with the daily pulse. And since October was marked by a number of severe disruptions between Paddington and Reading (mostly NOT due to First, for the record!) I'm going to hope - for the sake of our members - for a quieter November.
| Re: Some Site Statistics Posted by grahame at 20:48, 28th February 2015 | |
Our web server's log files are pretty big, and it's pretty hard to get an idea of what's going on from numbers - a picture paints many thousand words. Here are diagrams of requests per hour from the February logs.
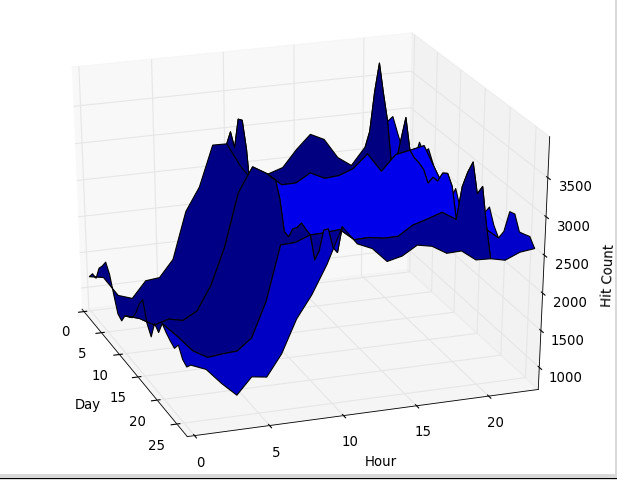
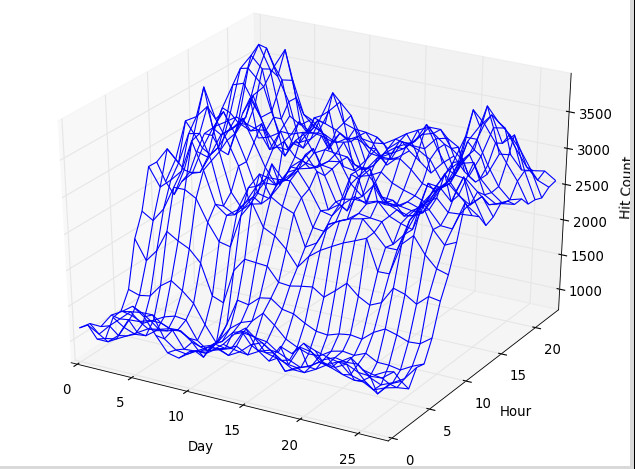
Technicalities (how to program things like this and to learn it), grabbed from the course I was giving last week:
http://www.wellho.net/mouth/4445_Graphing-presentations-in-Python-huge-data-numpy-and-matplotlib.html
| Re: Some Site Statistics Posted by grahame at 05:26, 27th March 2015 | |
Two attachments - a Google Analytics summary graph from the first four days of last week, and the same graph from the first four days of this week - I look a look to see whether there was any effect (and if so what) on our traffic from last Monday's announcement on the operation of trains in our area by First until 2019. It's probably a fair assumption that the traffic rise of people viewing posts was caused by the announcement - we can see it lead to a lot of extra contributions, and I can see no other factors that would have caused the rise in readership.
(The 20,687 views chart is from 16th to 19th March; the 32,076 one from 23rd to 26th March)
| Re: Some Site Statistics Posted by grahame at 08:25, 26th April 2015 | |
In response to questions about another site that we host, I've been back to Google Analytic logs to the start of 2013 - see http://www.wellho.net/mouth/4474_.html for graphs of how the Coffee Shop has performed against their measures over the past 28 months.
| Re: Some Site Statistics Posted by grahame at 08:25, 1st September 2015 | |
Although I don't post monthly in this thread, I do keep an eye on "how we're doing" month by month. Signs of things being a bit different in the sentiment of members would very likely show up in subtle changes in use patterns.
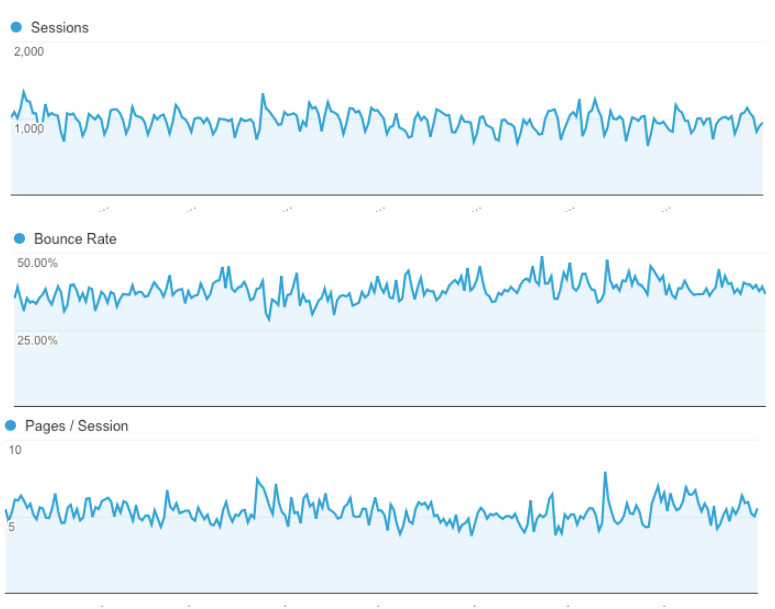
We continue to have about 1,000 human sessions per day, totalling around 5,000 page views. Around 380 of the sessions are for single pages (bounces) - so the "5 pages per session" chart could be split down to around 380 sessions to one page, and 420 user sessions visiting an impressive 11 pages on average. Graphs shown are 1st January to 31st August 2015.
Not shown, but 19 out of 20 sessions are from people within the UK (and many of the rest will be spam signup requests, of which we get a reduced but still significant number)
Many thanks to the admin and moderator team for helping keep on top of this lot. Yet I'm delighted just how little authoritative intervention is necessary - and that's a big "thank you" to the members too.
| Re: Some Site Statistics Posted by grahame at 01:26, 1st January 2016 | |
2015 ... 20,711 posts in 1,421 new subjects. 1,864,301 page views in 349,307 sessions by 120,976 users. A high of 1,855 sessions on 21st September, and a low of 460 on 25th December. 95% of sessions were from the UK, 1% from the USA, and the remaining 4% spread across 146 other countries. I remain amazed at just how many new subjects we come up with and how busy the site remains. A huge thank you to all our contributors.
And a piece of trivia ... a single page from each of Zimbabwe, Uganda, Tanzania, Timore-Leste, Togo, Swazilan, Syria, El Salvador, Somalia, Rwanda, Paraguay, Nicaragua, Malawi, Macedonia, Madagasgar, Moldova, Monaco, Liberia, Guatemaa, Guadaloupe, Gambia, Greenland, Belarus, Botswana, Antigua & Barbuda and Afghanistan.
| Re: Some Site Statistics Posted by ChrisB at 18:35, 27th February 2016 | |
Do they simply ignore those views from pax who don't let Google know their location? Or are they counted as a sort of 'we don't know'?
| Re: Some Site Statistics Posted by grahame at 04:24, 1st April 2017 | |
Looking back at the last five marches - 2017 at the top down to 2013 at the bottom

Source - Google Analytics
| Re: Some Site Statistics Posted by grahame at 16:56, 9th July 2017 | |
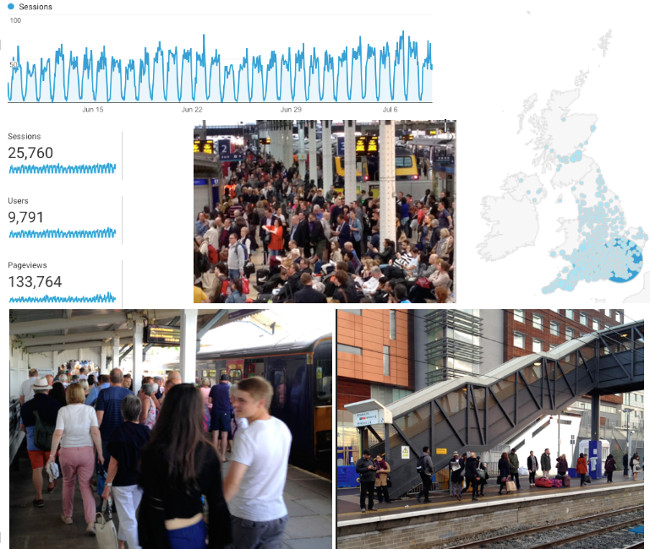
A promotional montage showing how busy we are and accompanying a Facebook post telling people what we're about.
If you're a Facebook member - please share - https://www.facebook.com/TransWilts/posts/1114374198662621 - although we have nearly 10,000 visitors in a month, I suspect there might be a few more who haven't heard of us
| Re: Some Site Statistics Posted by Adelante_CCT at 17:24, 9th July 2017 | |
What does the map of Britain show, and why does it look as if parts of Sussex, Kent, Essex and Hertfordshire are flooded?
| Re: Some Site Statistics Posted by grahame at 17:44, 9th July 2017 | |
What does the map of Britain show, and why does it look as if parts of Sussex, Kent, Essex and Hertfordshire are flooded?
Visitors to the forum by where in the UK their located ...the more from any one place, the bigger the circle and the deeper the colour. It's a map from Google Analytics and because so much internet traffic is marked as just "London" it looks odd.
Here are the top ten - number (and percentage) of sessions
:
1. London 5,823(22.60%)
2. Bristol 2,268(8.80%)
3. Reading 1,191(4.62%)
4. (not set) 1,115(4.33%)
5. Oxford 572(2.22%)
6. Exeter 445(1.73%)
7. Slough 415(1.61%)
8. Trowbridge 380(1.48%)
9. Birmingham 370(1.44%)
10. Maidenhead 337(1.31%)
2. Bristol 2,268(8.80%)
3. Reading 1,191(4.62%)
4. (not set) 1,115(4.33%)
5. Oxford 572(2.22%)
6. Exeter 445(1.73%)
7. Slough 415(1.61%)
8. Trowbridge 380(1.48%)
9. Birmingham 370(1.44%)
10. Maidenhead 337(1.31%)
The last 10 places - with one session each - were
:
912. Catalina Foothills
913. Delta charter Township
914. North Decatur
915. Lucena
916. Lipa
917. Tartu
918. Aktobe
919. Tachileik
920. Gibraltar
921. Portoroz
913. Delta charter Township
914. North Decatur
915. Lucena
916. Lipa
917. Tartu
918. Aktobe
919. Tachileik
920. Gibraltar
921. Portoroz
| Re: Some Site Statistics Posted by LiskeardRich at 17:50, 9th July 2017 | |
What does the map of Britain show, and why does it look as if parts of Sussex, Kent, Essex and Hertfordshire are flooded?
Visitors to the forum by where in the UK their located ...the more from any one place, the bigger the circle and the deeper the colour. It's a map from Google Analytics and because so much internet traffic is marked as just "London" it looks odd.
Here are the top ten - number (and percentage) of sessions
:
1. London 5,823(22.60%)
2. Bristol 2,268(8.80%)
3. Reading 1,191(4.62%)
4. (not set) 1,115(4.33%)
5. Oxford 572(2.22%)
6. Exeter 445(1.73%)
7. Slough 415(1.61%)
8. Trowbridge 380(1.48%)
9. Birmingham 370(1.44%)
10. Maidenhead 337(1.31%)
2. Bristol 2,268(8.80%)
3. Reading 1,191(4.62%)
4. (not set) 1,115(4.33%)
5. Oxford 572(2.22%)
6. Exeter 445(1.73%)
7. Slough 415(1.61%)
8. Trowbridge 380(1.48%)
9. Birmingham 370(1.44%)
10. Maidenhead 337(1.31%)
The last 10 places - with one session each - were
:
912. Catalina Foothills
913. Delta charter Township
914. North Decatur
915. Lucena
916. Lipa
917. Tartu
918. Aktobe
919. Tachileik
920. Gibraltar
921. Portoroz
913. Delta charter Township
914. North Decatur
915. Lucena
916. Lipa
917. Tartu
918. Aktobe
919. Tachileik
920. Gibraltar
921. Portoroz
I probably visited a few times from Skines, Chania, Crete during June.
| Re: Some Site Statistics Posted by bobm at 18:00, 9th July 2017 | |
Since I upgraded my broadband some IP locators have moved me to Scotland.....
| Re: Some Site Statistics Posted by TonyK at 13:17, 11th July 2017 | |
Since I upgraded my broadband some IP locators have moved me to Scotland.....
And me to either Cardiff or Poland. Plus I have checked in over the past 6 months from 8 foreign countries. Does this skew things?
| Re: Some Site Statistics Posted by grahame at 18:42, 11th July 2017 | |
Since I upgraded my broadband some IP locators have moved me to Scotland.....
And me to either Cardiff or Poland. Plus I have checked in over the past 6 months from 8 foreign countries. Does this skew things?
As IP addressed get reassigned, copy databases become less reliable if you're getting location from a site like GeoIP as we do for some stuff behind the scenes. However, Google Analytics probably uses its own system and keeps it very much current, and I would suspect that averaged out the geographic mapping of visitors is somewhere between "quite good" and "very good". I wouldn't trust individual splodges on the map, but I would accept the general pattern.
| Re: Some Site Statistics Posted by bobm at 21:36, 11th July 2017 | |
I looked earlier and I had been sent to Coventry. Says it all really!
| Re: Some Site Statistics Posted by JayMac at 21:43, 11th July 2017 | |
I'm not far from you, bobm. GeoIP has me in Walsall.
| Re: Some Site Statistics Posted by Chris from Nailsea at 23:47, 11th July 2017 | |
Since I upgraded my broadband some IP locators have moved me to Scotland.....
Brexit - with a vengeance.
| Re: Some Site Statistics Posted by grahame at 09:15, 1st March 2018 | |
Every so often, I take a look at the forum stats at a different angle (more often than I tell members about to keep me finger on the pulse!) ... and I have looked at a couple of thins this morning - all about FEBRUARY.
Post numbers in February each year since our foundation in 2007:
309 - 3626 - 1741 - 1775 - 1719 - 1623 - 2011 - 2424 - 1684 - 1472 - 1376 - 1869
Boards with over 30 messages / replies during the month just gone:
:
+------------+--------------+-----------------------------------------+
| post_count | board_number | board_name |
+------------+--------------+-----------------------------------------+
| 376 | 26 | Across the West |
| 147 | 51 | The Wider Picture in the United Kingdom |
| 130 | 30 | The Lighter Side |
| 122 | 14 | London to the Cotswolds |
| 93 | 5 | Buses and other ways to travel |
| 86 | 21 | Bristol Commuters |
| 84 | 40 | Looking forward - 2018 to 2045 |
| 79 | 18 | TransWilts line |
| 78 | 31 | The West - but NOT the West's trains |
| 76 | 3 | Smoke and Mirrors |
| 66 | 12 | London to the West |
| 60 | 4 | Fare's Fair |
| 43 | 7 | London to Reading |
| 43 | 35 | Frequent Posters Club |
+------------+--------------+-----------------------------------------+
| Re: Some Site Statistics Posted by grahame at 06:58, 1st May 2018 | |
Number of posts for April 2018 - 2132 - up from 1213 in April 2017
Number of posts for March 2018 - 2361 - up from 1796 in March 2017
Number of posts for February 2018 - 1869 - up from 1376 in February 2017
Historically, our post count fluctuation has reflected the fluctuation in performance and satisfaction with our main train provider (FGW, now GWR) with more posts suggesting more concerns. So not a good couple of months for them in their customer / passenger's eye.
Please note though that our March and April figures have been distorted by our own issues on the forum, with our server crash over Easter which has reduced the number of posts remaining on our server by between 100 and 150 for each of those two months.
| Re: Some Site Statistics Posted by Timmer at 10:46, 1st May 2018 | |
Wow! That's quite a jump and yes as you say sadly reflects on how things have been on the GWR network these past few months.
| Re: Some Site Statistics Posted by grahame at 05:32, 1st September 2018 | |
Number of posts for April 2018 - 2132 - up from 1213 in April 2017
Number of posts for March 2018 - 2361 - up from 1796 in March 2017
Number of posts for February 2018 - 1869 - up from 1376 in February 2017
Number of posts for March 2018 - 2361 - up from 1796 in March 2017
Number of posts for February 2018 - 1869 - up from 1376 in February 2017
Number of posts for August 2018 - 2270 - up from 1747 in August 2017
Number of posts for July 2018 - 2370 - up from 2135 in July 2017
Number of posts for June 2018 - 1852 - up from 1334 in June 2017
Number of posts for May 2018 - 2040 - up from 1158 in May 2017
| Re: Some Site Statistics Posted by grahame at 04:36, 1st October 2018 | |
Number of posts for April 2018 - 2132 - up from 1213 in April 2017
Number of posts for March 2018 - 2361 - up from 1796 in March 2017
Number of posts for February 2018 - 1869 - up from 1376 in February 2017
Number of posts for March 2018 - 2361 - up from 1796 in March 2017
Number of posts for February 2018 - 1869 - up from 1376 in February 2017
Number of posts for August 2018 - 2270 - up from 1747 in August 2017
Number of posts for July 2018 - 2370 - up from 2135 in July 2017
Number of posts for June 2018 - 1852 - up from 1334 in June 2017
Number of posts for May 2018 - 2040 - up from 1158 in May 2017
In September - 2346 posts. Down from 2499 in September 2017; interesting change in pattern ... first time this year we're down year on year.
September figure series, this decade ... 2311 - 2377 - 1430 - 1588 - 1782 - 1973 - 1487 - 2499 - 2346
| Re: Some Site Statistics Posted by grahame at 02:27, 1st November 2018 | |
Number of posts for April 2018 - 2132 - up from 1213 in April 2017
Number of posts for March 2018 - 2361 - up from 1796 in March 2017
Number of posts for February 2018 - 1869 - up from 1376 in February 2017
Number of posts for March 2018 - 2361 - up from 1796 in March 2017
Number of posts for February 2018 - 1869 - up from 1376 in February 2017
Number of posts for August 2018 - 2270 - up from 1747 in August 2017
Number of posts for July 2018 - 2370 - up from 2135 in July 2017
Number of posts for June 2018 - 1852 - up from 1334 in June 2017
Number of posts for May 2018 - 2040 - up from 1158 in May 2017
In September - 2346 posts. Down from 2499 in September 2017; interesting change in pattern ... first time this year we're down year on year.
September figure series, this decade ... 2311 - 2377 - 1430 - 1588 - 1782 - 1973 - 1487 - 2499 - 2346
Up again 10% in October - 2111 to 2322 year on year. I would say "just general ebb and flow" except that there were a handful of exceptionally busy days which coincided with rail incidents such as "all stops" between Newton Abbot and Exeter, and between London and Reading.
| Re: Some Site Statistics Posted by grahame at 05:54, 1st December 2018 | |
November was our busiest month on the Coffee Shop for over a decade and our third busiest ever.

The correlation between GWR having problems and post numbers seems to have been broken - thank goodness. In other words, although our post numbers have gone up, I don't think there have been worse problems - indeed, anecdotal evidence suggests that things might have started heading in the right direction. Ironically I started writing this on a freezing platform at Chippenham .. I'm going to be 80 minutes late home because of a connection failure, and the way it works at Chippenham is that when you relly need the waiting room (as it gets late and cold) they chuck you out.
Our growth ... is somewhat fertilised by a number of new members. And nurtured by our existing members and team. I hope that I or another of the moderators / admins has welcomed each at their first post, and made the feel very welcome. Changes at the TransWilts Community Rail Partnership this autumn have released me and others from a number of constraints put on the exposure of the Coffee Shop to potential new members, and I think that change may have helped us reach some new members already. And, with this new more visible situation I have been looking and asking around at rail meetings of all sorts - finding and meeting a handful of members at most of them. Interesting.
The graph is spikey - although just a few short of 3,000 posts in November, and headed past that landmark in the future, don't expect magic in December ...
| Re: Some Site Statistics Posted by JayMac at 06:18, 1st December 2018 | |
December was our busiest month on the Coffee Shop
December?
Can I have a go in your time machine?
| Re: Some Site Statistics Posted by grahame at 06:24, 1st December 2018 | |
December was our busiest month on the Coffee Shop
December?
Can I have a go in your time machine?
Oops. Post corrected.
| Re: Some Site Statistics Posted by TonyK at 17:20, 8th December 2018 | |
December was our busiest month on the Coffee Shop
December?
Can I have a go in your time machine?
It's broken. Can't understand it - it was fine next week.
| Re: Some Site Statistics Posted by grahame at 08:22, 1st January 2019 | |
Posts in 2016 - 18,007. Posts in 2017 - 22,300. Posts in 2018 - 27.079.
Rise on year to December 2017 - 23.8%.
Rise on year to December 2018 - 21.4%.
| Re: Some Site Statistics Posted by grahame at 08:38, 10th January 2019 | |
In answer to a suggestion that "it's always the same dozen people who post" I have taken a look back to the start of this year ... yes, just 9 and a bit days ... to reveal
217 different users have been logged in (*) . 84 of them have posted - 582 messages in total so far.
In the last 12 months, 267 different users have posted.
Edit to add ...
(*) - that's users logged in - there have been around 1,500 visitors if you count guests as well as logged in members.
| Re: Some Site Statistics Posted by TonyK at 22:00, 22nd January 2019 | |
I don't know if I am typical, but I "lurked" for quite a while before making my first tentative post. I would look forward to seeing some of those visitors making the same quantum leap this year.
| Re: Some Site Statistics Posted by eXPassenger at 09:45, 23rd January 2019 | |
I don't know if I am typical, but I "lurked" for quite a while before making my first tentative post. I would look forward to seeing some of those visitors making the same quantum leap this year.
Same here. I lurked to understand the culture and operation of the board. I only joined when I felt I could contribute positively to the discussion.
| Re: Some Site Statistics Posted by grahame at 10:01, 23rd January 2019 | |
I don't know if I am typical, but I "lurked" for quite a while before making my first tentative post. I would look forward to seeing some of those visitors making the same quantum leap this year.
Same here. I lurked to understand the culture and operation of the board. I only joined when I felt I could contribute positively to the discussion.
Gentlemen, the admin / moderator team appreciates your natural British reserve ... and there have been many others who have signed up and left their virgin post to months or years later. However, we are a forum for passengers, passengers have questions and really should not be put off posting ... some of the more basic questions, indeed, are the lifeblood of the forum and it's great to have hooks onto which the more-experienced can hang answers. I strongly encourage newcomers to join and post - just don't flood/spam us with 400 posts in 2 months!

http://www.firstgreatwestern.info/better/day6.html
| Re: Some Site Statistics Posted by grahame at 06:21, 1st March 2019 | |
February posts dipped below 2,000 ... first time in.year. "Just" 1896 posts. But then it was the busiest February since 2014 ... and February 2014 was the month that the Dawlish Sea Wall got washed out (was that really five years ago?). February is also a short month - posts per day average up from 65 per day in January to 68 per day in February, with a whole background of no major weather problems or announcements.
I don't have (easy to access) stats - but noting (and big welcome) to new members last month - more I think than in a typical month. We never have a flood of people joining, and value each and every one of you. Double plus welcome to those who have posted for the first time too.
| Re: Some Site Statistics Posted by grahame at 01:35, 30th May 2019 | |
Some stats work I have been doing ... on visits to the Coffee Shop
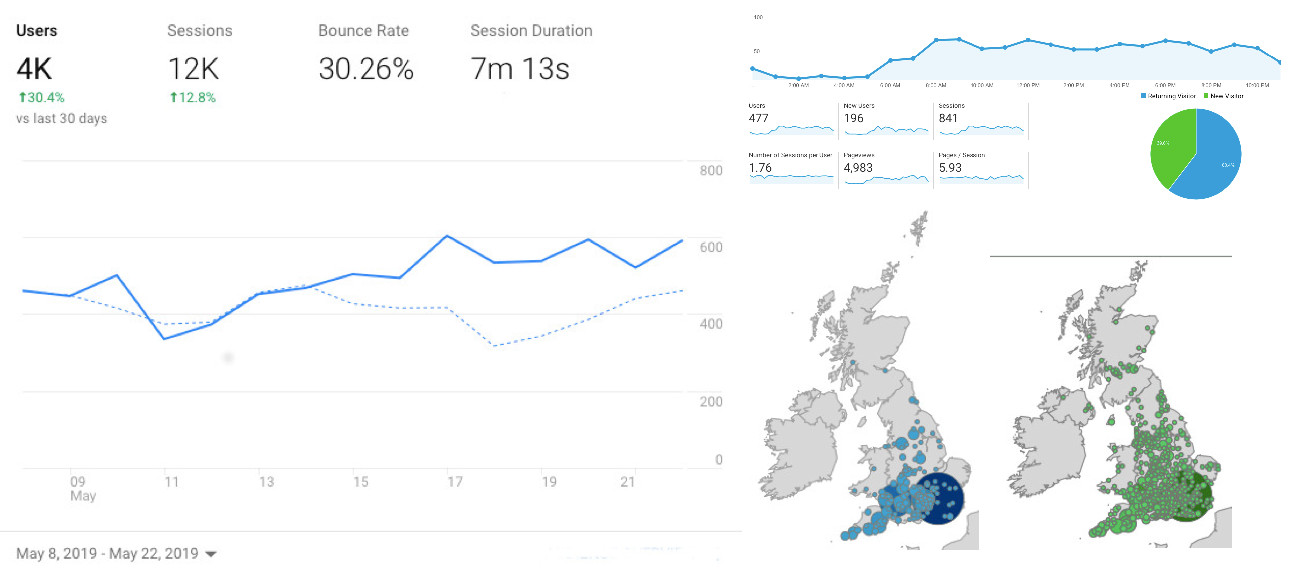
Left hand diagram shows (solid line) sessions over a 2 week period in May leading up to and after Community Rail in the City. Dashed line is same 2 week period in April. Easy to draw spurious conclusions ... April dip in the second week was due to a small event called Easter, and I have no doubt that part of the reason for the rise second week in May was to do with the final 4 HSTs in regular service off Paddington.
Top right diagram shows visits per hour yesterday
Maps show UK location of visitors yesterday (blue spotted diagram on left) and for the last 4 weeks (green spotted diagram on right). I was going to use just the 4 week diagram, but there was so much data on there it was a flooded page so I thinned it out to just a typical day; nothing special about yesterday that I'm aware of for that diagram or the one above.
If you load the image above into a separate window / tab, you'll see it a little bigger. For download purposes I've used a .jpg and being a diagram rather that a picture, it remains a low bandwidth item!
| Re: Some Site Statistics Posted by SandTEngineer at 10:11, 30th May 2019 | |
Nice to see there are big blue and green dots over my house.....
| Re: Some Site Statistics Posted by TonyK at 21:44, 4th June 2019 | |
| Re: Some Site Statistics Posted by grahame at 07:11, 1st July 2019 | |
Post numbers have dipped in June to 1978 - slightly below the 2,000 level which is what I treat as a very loose target. Having said which, June is typically a quiet month for posts. The numbers are up on last year (1852 posts), on 2017 (just 1334 posts that June) and 2016 (1348 posts) ...
| Re: Some Site Statistics Posted by grahame at 06:57, 17th August 2019 | |
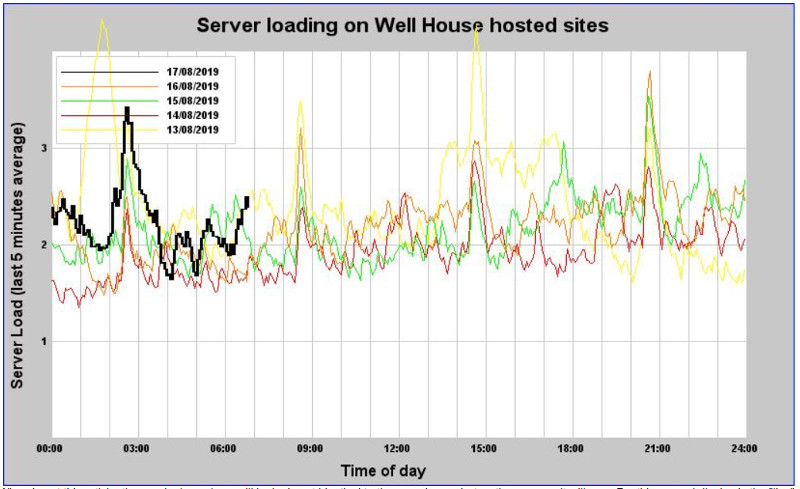
Off the routine monthly cycle of quoting a few server stats, here are some mid-month graphs. Spotting some characteristics that are a little different, I spent the last couple of hours taking a look; sharing some of the graphs


| Re: Some Site Statistics Posted by Reginald25 at 07:17, 17th August 2019 | |
most online 845 at 3 in the morning today?
| Re: Some Site Statistics Posted by grahame at 07:25, 17th August 2019 | |
most online 845 at 3 in the morning today?
Indeed - that unusual happening was what brought me along to have a look!
| Re: Some Site Statistics Posted by bobm at 07:30, 17th August 2019 | |
Well that has broken a long standing record.
Incidentally who programmed the software to show the time as 03:26:53 am
| Re: Some Site Statistics Posted by grahame at 07:42, 17th August 2019 | |
Well that has broken a long standing record.
Incidentally who programmed the software to show the time as 03:26:53 am
Incidentally who programmed the software to show the time as 03:26:53 am
I'm analysing ... looks like a lot of Google references from China, and not to any specific page. Keeping an eye on it ... even as I write, still around 750 "users" where previous record was 488. Expect to see a glitch in site stats tomorrow.
| Re: Some Site Statistics Posted by stuving at 10:15, 17th August 2019 | |
Incidentally who programmed the software to show the time as 03:26:53 am
Why not? Isn't 03:26:53 pm a valid date? The orthography may be unfamiliar, but...
| Re: Some Site Statistics Posted by Surrey 455 at 11:38, 17th August 2019 | |
Incidentally who programmed the software to show the time as 03:26:53 am
Why not? Isn't 03:26:53 pm a valid date? The orthography may be unfamiliar, but...
No. I would call it the time!
| Re: Some Site Statistics Posted by stuving at 11:52, 17th August 2019 | |
Incidentally who programmed the software to show the time as 03:26:53 am
Why not? Isn't 03:26:53 pm a valid date? The orthography may be unfamiliar, but...
No. I would call it the time!
A lot of common sayings don't bear close examination, and "you can't turn back the clock" must be about the silliest. Obviously you can - we all do it to match conventional time as it changes, with place or season. We can also do it for any other reason, for no reason, or by mistake. What we can't do is change time itself to match a clock.
On top of that, if you do turn your clock back a whole day, it says ...exactly the same. While a clock may have a date indication, that bit is a calendar, not a clock. (Electronics and computer jargon is different from everyday usage in this.) Of course you can't change time itself to match a calendar either.
But now I shall have to admit that confusing clocks and calendars just human nature, and hardly warrants such criticism.
| Re: Some Site Statistics Posted by grahame at 05:13, 1st September 2019 | |
We have just completed the busiest August ever on the forum (measured in number of posts) - looking all the way back to 2007. Not by a huge amount, but the busiest anyway.
Part of the growth can - for once - be assigned to a big positive - that was "Meet the Manager" when Mark Hopwood came onto the forum to answer questions early in the month. There is still a tail of that to follow up - thank you for various reminders over the last few days and, please, the delay / lack of that follow up relates to the forum and not to Mark or his team ... and we should concede "Meet the Manager" with a further "Thank you" and a rosy glow of how it worked, even though some of the elements discussed remain far from rosy.
Just like August 2018, the forum was busy in August 2019. And, sadly, a significant amount of that remains concerns at issues ... staff shortages, cancellations, infrastructure issues have not gone away. Indeed short term cancellations on the TransWilts feel even worse than in previous years, and planned engineering service reductions have been replaced by very short notice (a few hours up to a a day) which really knock passenger confidence. We also have new problems like overhead wire problems. I do look forward to a quieter forum at some time in the future because there's nothing going wrong to take about - though even better would be a forum where we're onto positives ... pictures of the construction of Aztec West station, new artwork at Portishead, marketing of the combined rail-and-bus Wessex season, welcoming the increase from 5 to 8 carriages on the half hourly Swansea to Portsmouth service, and celebrating the ForAll railcard.
| Re: Some Site Statistics Posted by grahame at 15:57, 21st October 2019 | |
In answer to a question I was asked ...
In the last day, 23 different members have posted
In the last week, 67 different members have posted
In the last month, 108 different members have posted
| Re: Some Site Statistics Posted by MVR S&T at 21:33, 21st October 2019 | |
A half hourley Swansea to Portsmouth and back, with 4 Voyager is but a dream, let alone 8 (HST?) would get me out and about again for sure, to Salisbury, Bradford on avon, Bath, Bristol, oh so many other nice places, fom here in Christchurch, well Hinton Admiral.
| Re: Some Site Statistics Posted by grahame at 23:16, 1st January 2020 | |
Some stats from 2019 from Google Analytics, comparing the Coffee Shop's traffic to other domains I took after on our server.
| Users | uk | session | pageviews | |
| 49 | 8 | 57 | 61 | Site 1 |
| 278 | 38 | 306 | 340 | Site 2 |
| 379 | 54 | 389 | 546 | Site 3 |
| 693 | 378 | 974 | 2879 | The Well House Collection |
| 2808 | 2198 | 5650 | 11178 | MRUG |
| 65174 | 58195 | 269900 | 1715971 | Coffee Shop |
| 390120 | 37359 | 455138 | 534998 | Well House Consultants |
I know we have some folks here who look after other web sites ... I would be very interested to know what the stats for some of them look like. I appreciate that would probably be private / in confidence rather than publishing stats and naming as I have done for four sites.
| Re: Some Site Statistics Posted by grahame at 20:34, 29th January 2020 | |
In answer to a question I was asked ...
In the last day, 23 different members have posted
In the last week, 67 different members have posted
In the last month, 108 different members have posted
In the last day, 23 different members have posted
In the last week, 67 different members have posted
In the last month, 108 different members have posted
I thought back to this post this evening ... when I noticed that each of the last seventeen posts has been by a different member. Rather sadly, I'm about to break the sequence as I posted something else just prior to this.
| Re: Some Site Statistics Posted by grahame at 13:59, 1st March 2020 | |
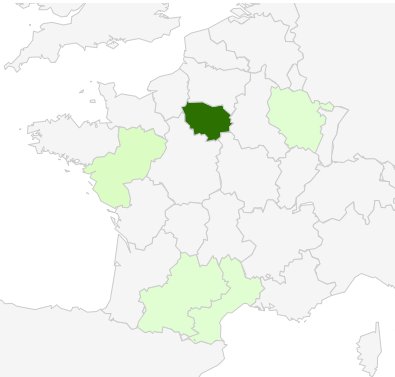
We had a visitor from Eswatini last month (yes, I had to look that up) ... and 4,513 from the UK, who came back (on average) between 4 and 5 times (20,216 sessions), visiting (again on average) 6.28 pages per session.
Early in the month, we also saw unwanted activity from Hong Kong - 1,156 users only one of whom came back, and each of whom visited just one page. These users were arriving in droves - arrival rates up to 20 times what we normally see and tested our server (I had at one point to reload databases); for the month as a whole, they accounted for 18% of our visitors (grand total 6,462) but less than 1% of pages served. I have added something to our server configuration to spot these visitors and reject their requests meaning that they no longer get anywhere near the stats I am reporting, but there does remain a small resource call each time they ask and we tell them to "**** off". In future, I would expect to see other similar activity, modified (as happens with these things) so that they no longer get sent packing until I put another line in the server config. I don't believe this is a specific attack on the Coffee Shop - just us being caught in crossfire.
1670 posts in the month - not untypical for a February, with 125 new topics started. Which works out as 13.4 posts per topic. 5 years ago, it was 11.9 posts per topic and 10 years ago it was 12.2, so once again remarkably stable.
| Re: Some Site Statistics Posted by grahame at 14:40, 1st April 2020 | |
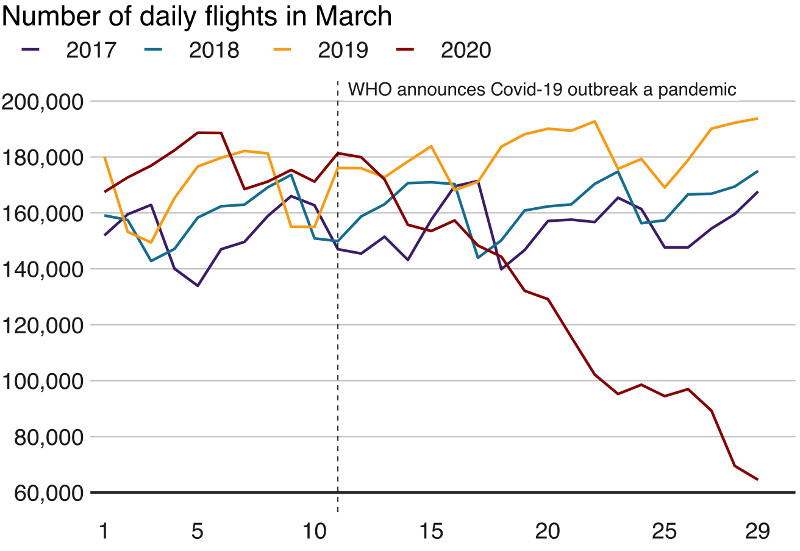
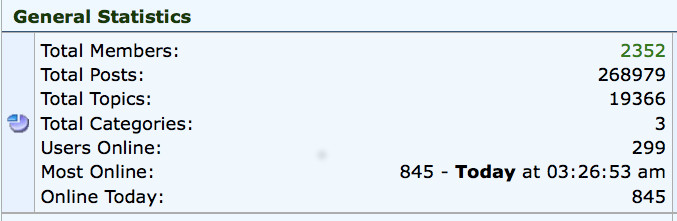
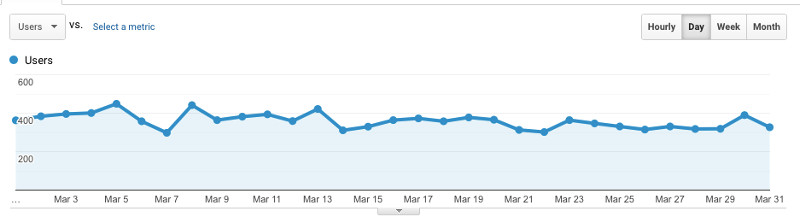
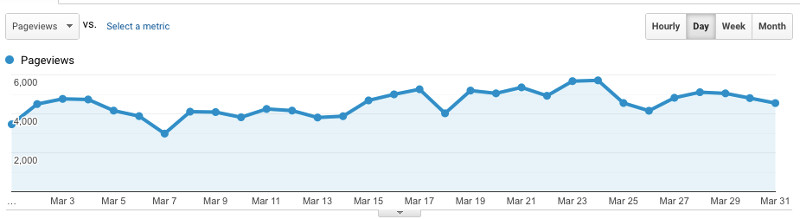
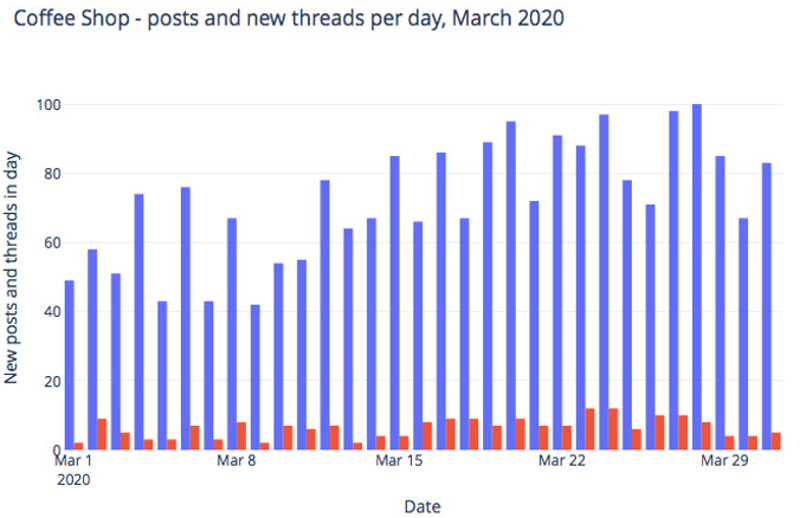
What an extraordinary month! Various sources - All for March 2020
Marginally fewer different users
Number of pages broadly unchanged
Number of pages per session increases

Number of posts increases during month
Public transport use falls off a cliff! (Government briefing)
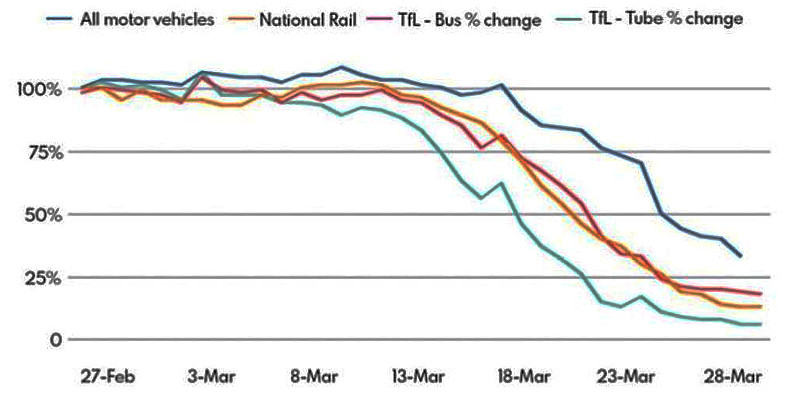
and via https://www.bbc.co.uk/news/business-52105526 :